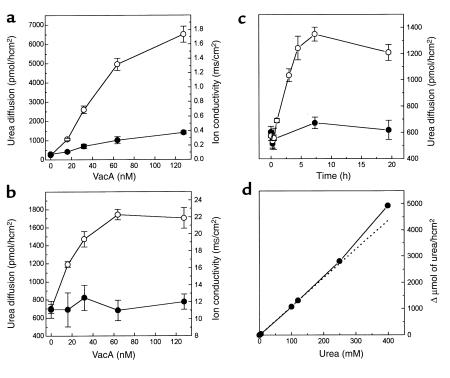
Figure 2.
Dose response, kinetics, and unsaturability of VacA-induced urea transepithelial flux. Cell monolayers of MDCK I (a) and MDCK II (b) were apically treated with the indicated concentrations of activated VacA in DMEM, 10% FCS for 3 hours at 37°C. Transepithelial urea diffusion (open circles) and ion conductivity (filled circles) were determined. Values are the mean of four experiments in duplicate ± SE. (c) After the indicated intoxication times with activated (open circles) or nonactivated (filled circles) VacA (125 nM), transepithelial urea flux across MDCK II cell polarized monolayers was determined. The averages of two experiments run in duplicate are reported with average deviations. (d) After a 3-hour treatment with VacA, as above, 45 μM [14C]urea plus the indicated concentration of cold urea was placed in the basolateral chamber. The amount of radioactivity in the apical chamber was then measured, yielding plots analogous to those in Figure 1, c–e, whose slopes are plotted. The dotted line represents the theoretical linear correlation.

