
Figure 3.
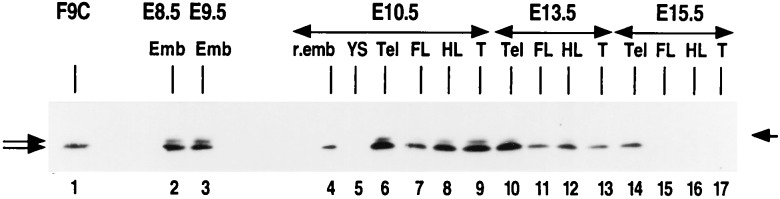
Western blot analysis of HSF2 distribution in postimplantation embryos. F9C, extracts from F9 control cells. Left arrows indicate both HSF2 splicing isoforms; the right arrow indicates the 80-kDa molecular mass marker.
Official websites use .gov
A
.gov website belongs to an official
government organization in the United States.
Secure .gov websites use HTTPS
A lock (
) or https:// means you've safely
connected to the .gov website. Share sensitive
information only on official, secure websites.
Western blot analysis of HSF2 distribution in postimplantation embryos. F9C, extracts from F9 control cells. Left arrows indicate both HSF2 splicing isoforms; the right arrow indicates the 80-kDa molecular mass marker.