Figure 1.
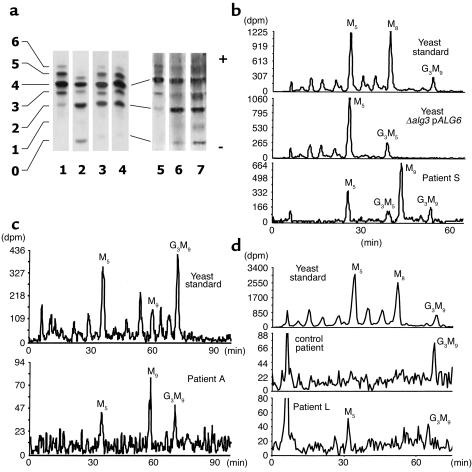
(a) Isoelectric focusing of serum transferrin. Data from two different experiments are shown. The number of negative charges (sialic acid residues) is given at the left. Transferrin from healthy control individuals (lanes 1 and 5), from CDG-1a patients (lanes 2 and 7), from patient L (lane 3), patient A (lane 4), and patient S (lane 6) was analyzed. (b–d) Analysis of LLOs in CDG patients, control subjects, and yeast cells. Metabolically labeled LLOs were isolated from wild-type yeast cells (standard), ALG3-deficient yeast cells overexpressing the ALG6 locus (Δalg3 + pALG6), and fibroblasts derived from patient S (b), patient A (c), and patient L (d). [3H]oligosaccharides were released by mild acid hydrolysis and analyzed by HPLC. Elution was monitored by a radiodetector. The elution positions of Glc3Man9GlcNAc2 (G3M9), Man9GlcNAc2 (M9), Man8GlcNAc2 (M8), Man5GlcNAc2 (M5), and Glc3Man5GlcNAc2 (G3M5) are indicated.

