
Figure 2.
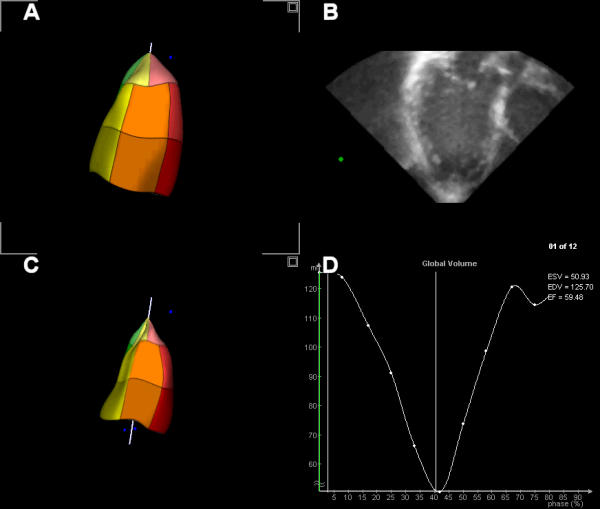
End-diastolic (A) and End-systolic (C) reconstruction of the left ventricle after semi-automated border analysis of the long-axis views (B). Time volume curve from which ejection fraction can be derived (D).
Official websites use .gov
A
.gov website belongs to an official
government organization in the United States.
Secure .gov websites use HTTPS
A lock (
) or https:// means you've safely
connected to the .gov website. Share sensitive
information only on official, secure websites.
End-diastolic (A) and End-systolic (C) reconstruction of the left ventricle after semi-automated border analysis of the long-axis views (B). Time volume curve from which ejection fraction can be derived (D).