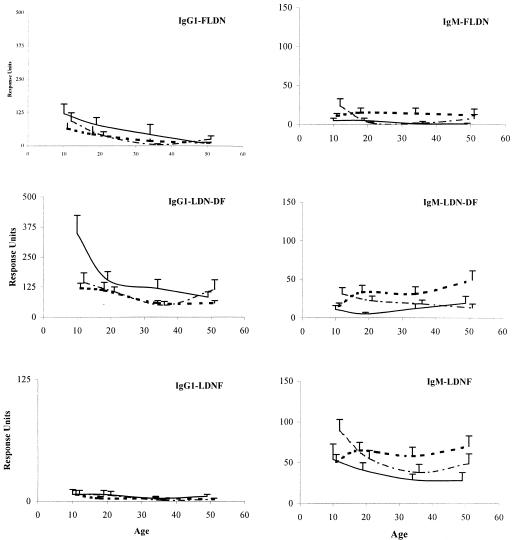
FIG. 1.
Specific IgG1 and IgM responses against FLDN, LDN-DF, and LDNF versus age. Results are expressed as the geometric mean RU which were detected by SPR spectroscopy in the Kenyan resident cohort sampled in March 1994 (thick dotted line) and the immigrant cohort sampled between May and November 1993 (black line) and between August and September 1995 (dashed line). Error bars represent the 95% confidence intervals.

