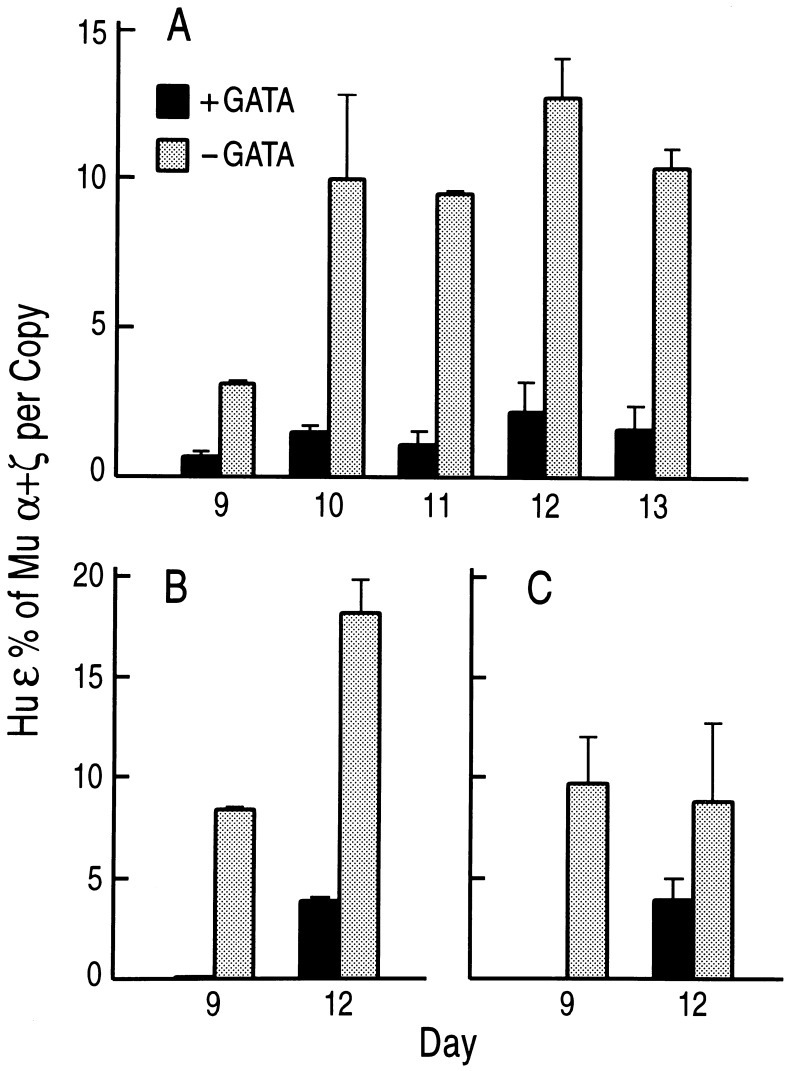
Figure 3.
Comparison of human ɛ gene expression in βYAC mice carrying or lacking the hGATA-1 transgene. The solid columns represent expression of the human ɛ gene in hGATA(+) mice, the hatched columns show ɛ expression in hGATA(−) mice. Gestational ages are shown on the horizontal axis. Human ɛ mRNA level is expressed as a percentage of the murine α plus ζ mRNA (both human and murine mRNA expression was corrected for copy number). Each column represents the mean of mRNA quantitations of several fetuses; the bars in each column indicate standard deviations. (A–C) Results from the mating of hGATA-1 mice with mice from the βYAC lines A–C, respectively.

