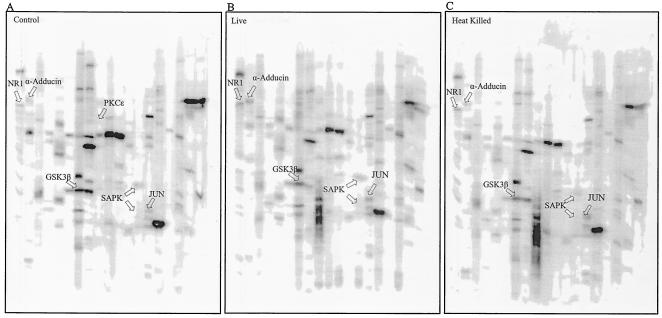
FIG. 1.
Multiphosphoprotein analysis of THP-1 cells infected with live and heat-killed M. bovis BCG. Each sample is represented as a phosphoprotein fingerprint. Accurate intensity values for each band are the accumulated signal obtained over a given scan time for each blot. These are shown as numerical values in Table 1. The data shown here represent protein bands visualized as a snapshot of the scan time and may therefore not represent exact band intensities. The three gels represent untreated THP-1 cells (A), THP-1 cells infected with live M. bovis BCG (B), and THP-1 cells infected with heat-killed M. bovis BCG (C). Each lane was probed with one or more antibodies. The proteins indicated by arrows are discussed in the text. Lanes 1 and 21 in each panel contained molecular size standards. Antibodies against the phosphorylated proteins were as follows: lanes 2, NR1 (S896); lanes 3, adducin (S724) and CDK1 (Y15); lanes 4, CREB (S133); lanes 5, ERK1/2 (T202/Y204) (T183/Y185) and p70 S6K (T389); lanes 6, RSK (T360/S364), RAF1 (S259), and MEK1/2 (S217/S221); lanes 7, GSK3α (S21), GSK3β (S9), and PKB (T308); lanes 8, GSK3α (Y279/Y216); lanes 9, PKR1 (T451); lanes 10, PKCɛ (S719); lanes 11, PKCα (S567); lanes 12, PKCα/β (T638) and SRC (Y529); lanes 13, PKCδ (T505); lanes 14, SAPK (T183/Y185); lanes 15, MSK 1/2 (S376) and JUN (S73); lanes 16, JAK2 (Y1007/Y1008) and p38MAPK (T180/Y182); lanes 17, STAT1 (S701); lanes 18, STAT3 (S727); lanes 19, RB (S780); lanes 20, RB (S807/S811).

