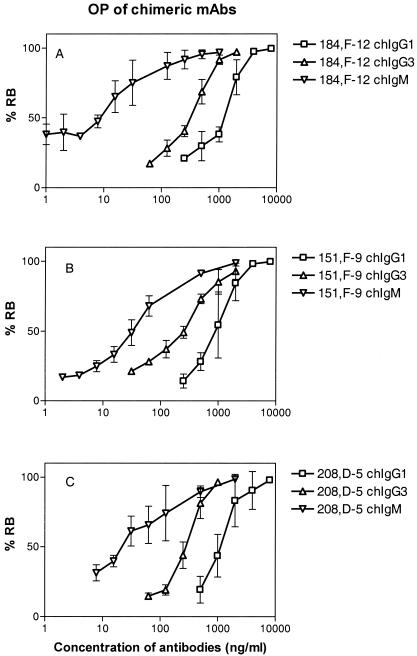
FIG. 4.
Dose-response curves for RB of the chIgG1, chIgG3, and chIgM sets of antibodies. (A) Antibodies containing the V region of MAb 184,F-12 (anti-P1.16). (B) Antibodies containing the V region of MAb 151,F-9 (anti-P1.16). (C) Antibodies containing the V region of MAb 208,D-5 (anti-P1.7). OP was measured with a flow cytometer and was expressed as percentage of the effector cells (human PMNs) undergoing RB as described in Materials and Methods. The results are the means of three independent experiments. The error bars indicate standard deviations. The RB activity was expressed as the lowest antibody concentration (in nanograms per milliliter) able to induce RB in 50% of the PMNs, as shown in Table 1 and Fig. 3.

