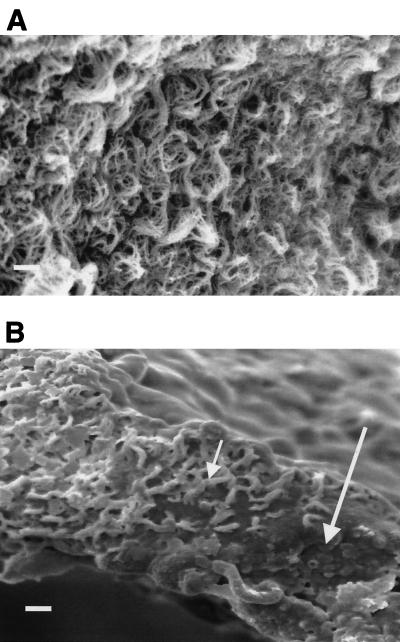
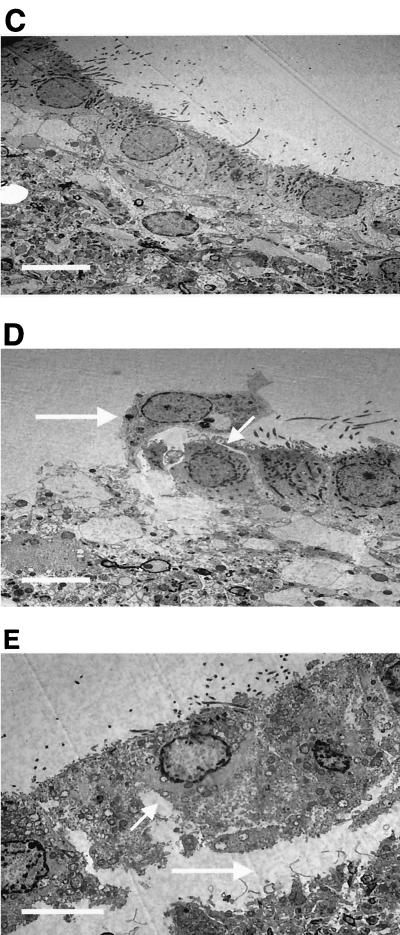
FIG. 3.
SEM (A and B) and TEM (C, D, and E) results for the floor (zone 2) of the fourth ventricle for control rats (A and C) and rats with meningitis (B, D, and E) (CSF at 107 CFU/ml). The small arrow in panel B shows clumping of the cilia, and the large arrow in panel B shows the loss of cilia in the floor of the fourth ventricle, with no cilia present. The TEM images show the opening of gap junctions (D and E; small arrows) and detachment of the ependymal cells (D and E; large arrows). Images are representative of 50 others. Bar, 10 μm.


