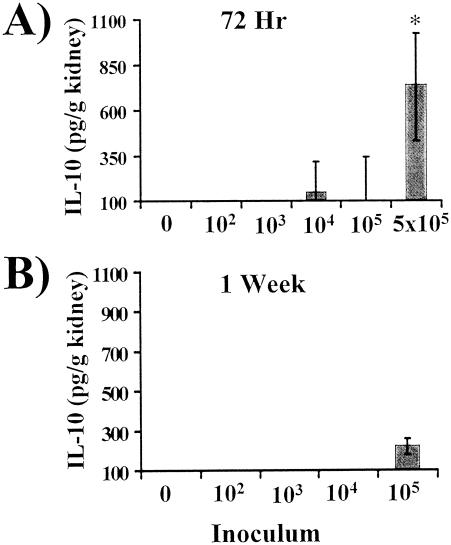
FIG. 6.
Whole-organ IL-10 analysis by ELISA of kidneys from mice inoculated with 1 × 10², 1 × 10³, 1 × 10⁴, 1 × 10⁵, or 5 × 10⁵ wild-type C. albicans organisms or with PBS (0). The lowest points on the y axes represent the lower limits of detection of the ELISA. Data are displayed as medians ± interquartile ranges from two experiments with six mice per group. *, P < 0.05 by the Steel test versus values for uninfected mice.

