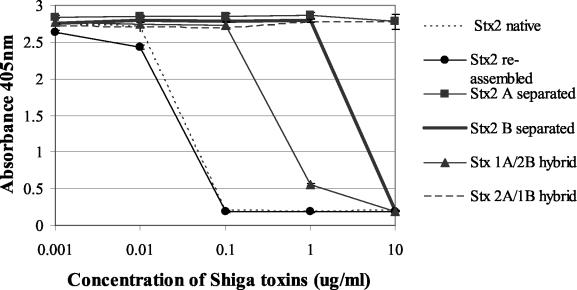
FIG. 3.
HuSAP competitive binding to immobilized Stx2 in the presence of increasing concentration of soluble Stx proteins. The data represent the average (n = 3) for each dilution, and error bars represent standard deviations. Missing error bars indicate that the deviations were too small to appear on the graph.

