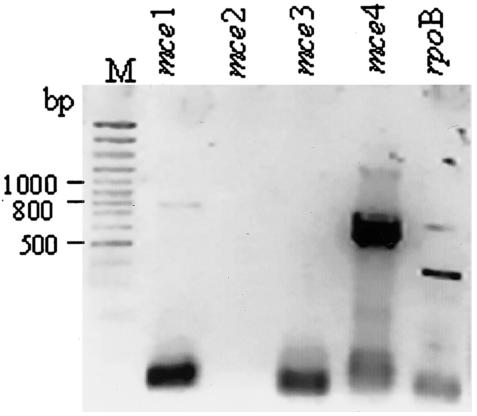
FIG. 3.
Analysis of expression profile of mce operons in stationary phase. Amplicons of RT-PCR with operon-specific primers as indicated above each lane were analyzed; rpoB was used as a positive control. M, 100-bp ladder. The RNA from 20-day-old cultures was used at a concentration of 500 ng per 20 μl of reaction mixture. The fast-moving band has the primer dimers.

