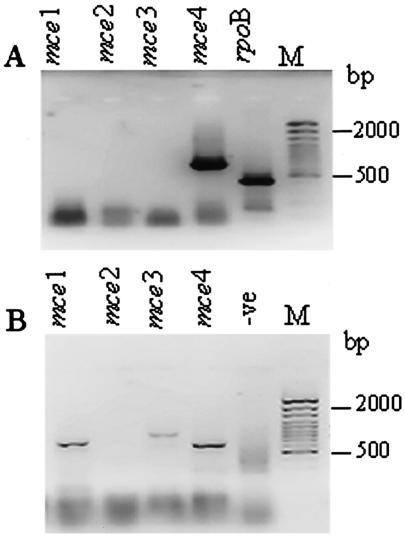
FIG. 4.
Analysis of expression profile of mce operons in bacilli from spleens of infected guinea pigs (A) and from pulmonary tubercles from infected rabbits (B). The amplicons are from RT-PCR with operon-specific primers as indicated above each lane; rpoB-specific primers were used as a positive control. M, 100-bp ladder; -ve, negative control, where the RT step was omitted for rpoB-specific primers to rule out DNA contamination. The RNA concentration was 300 ng per 20 μl of reaction mixture in each case. The fast-moving band has the primer dimers.

