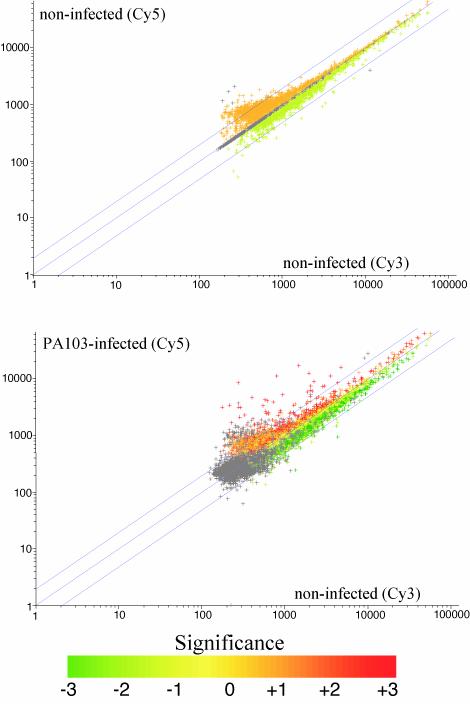
FIG. 1.
Scatterplot profiles of 9HTEo− cell genes after microarray hybridization and normalization. Each plot represents the Cy3 versus Cy5 expression intensity ratios of 9,243 genes derived from microarray hybridization experiments comparing noninfected and noninfected cells (top) or comparing noninfected and PA103-infected cells (bottom). Genes which lie outside the upper and lower twofold boundaries (blue lines) are significantly up- or downregulated in infected versus noninfected cells. The significance of these expression changes are indicated by graded coloring from one, two, or three standard deviations difference between infected and noninfected intensities. Gray color refers to genes lacking duplicate datum points.

