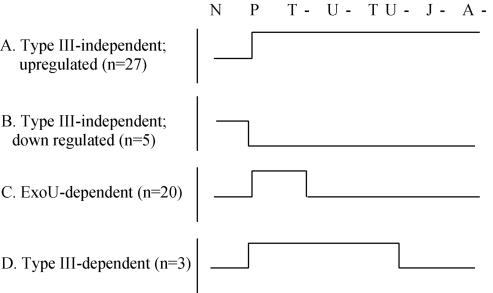
FIG. 2.
Expression patterns of 9HTEo− cell genes regulated after P. aeruginosa infection. A total of 55 genes that showed >2-fold difference between noninfected cells (N) and cells infected by P. aeruginosa PA103 parental (P), exoT (T-), exoU (U-). exoT exoT (TU-), pscJ (J-), and pilA (A-) were clustered into four different expression profile classes (A to D). The number of genes in each group is indicated in parentheses.

