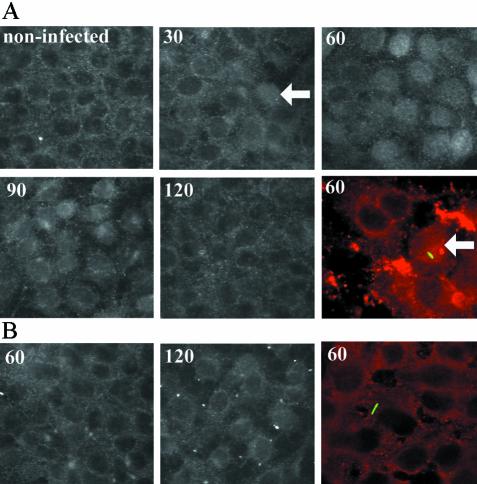
FIG. 4.
Immunolocalization of c-Fos expression. Black and white panels represent images of cells immunostained with anti-c-Fos antibody after exposure to P. aeruginosa strains PA103 (A) or PA103 exoU (B) for different lengths of time as indicated (in minutes). Color panels represent images of cells doubly stained with anti-c-Fos antibody (red channel) and anti-P. aeruginosa antibody (green channel). Examples of nuclear localized c-Fos are indicated with arrows. Magnification, ×600.

