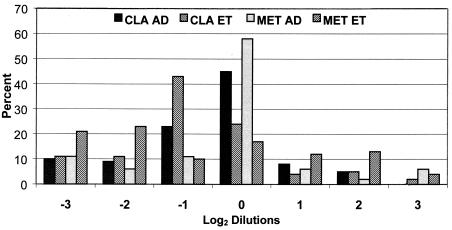
FIG. 2.
Percent distribution of clarithromycin (CLA) and metronidazole (MET) log2 dilution MICs by agar dilution (AD) and E test (ET) relative to the average agar dilution MICs for all strains of H. pylori from all sites. A dilution at 0 is equivalent to the average MIC for that strain of H. pylori. Results at −3 and 3 include dilutions equal to and less than or greater than 3 log2 dilutions different from the average, respectively. Compared to the reference agar dilution method, E test MICs tended to be lower than the average, but the numbers of unacceptable results at −3 or 3 were relatively equivalent by all methods.

