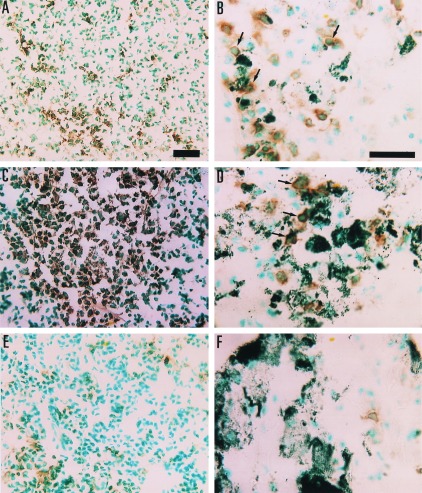
Figure 6.
Micrographs of IFN-γ positive cells in histological sections from spleen (A, C, and E) and lung (B, D, and F) of B16-C215 tumor-bearing TCR Vβ3 TG mice. The immunoreaction is visualized by diaminobenzidine, giving a brown color at the site of reaction. A and B are from mice treated with Fab–SEA D227A, C and D are from mice treated with Fab–SEA, and E and F are from a control animal injected with PBS. Note the close proximity of IFN-γ positive cells and melanin-pigmented B16-C215 cells in treated animals in B and D (arrows). (Bars = 25 μm for A–F.)

