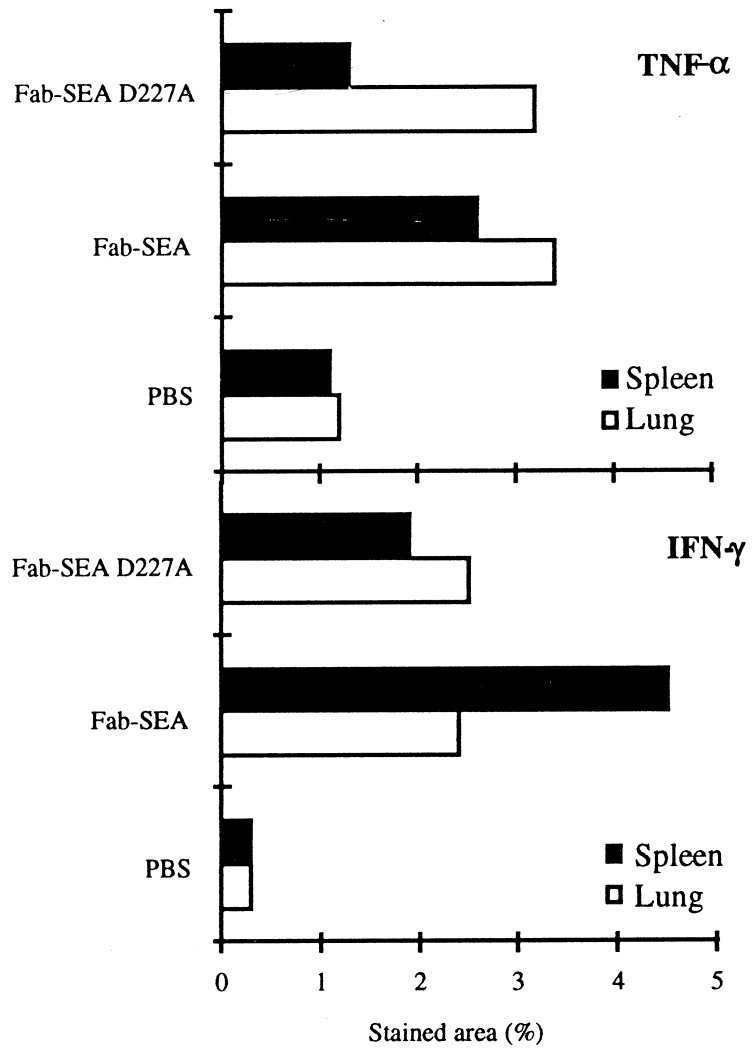
Figure 7.
Quantitation of cells stained for TNF-α and IFN-γ in histological section from spleen and lung of B16-C215 tumor-bearing TCR Vβ3 TG mice. Quantitation of stained cells was performed by image analysis and data represents mean of the positively stained area after serial scanning of whole cryostat sections.

