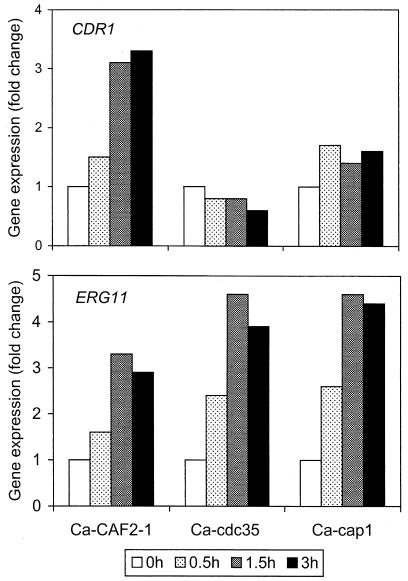
FIG. 6.
Comparative expression of CDR1 (top) and ERG11 (bottom) in itraconazole-treated cultures of the indicated C. albicans wild-type and mutant strains. Itraconazole (0.25 μg/ml) was added to cultures at 0 min, and aliquots were removed for RNA extraction at 0, 0.5, 1.5, and 3 h as indicated. Slot blot hybridization and densitometric analysis were used to quantitate gene expression as described in Materials and Methods. Expression was normalized to ACT1 RNA levels and was represented as change (n-fold) relative to the 0-h time point.

