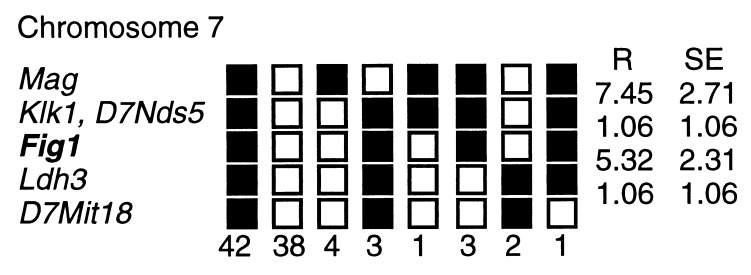
Figure 3.
Genetic mapping. Haplotype figure from The Jackson Laboratory BSS backcross showing part of chromosome 7 with loci linked to Fig1. Loci are listed in order, with the most proximal at the top. Solid boxes represent the C57BL6/JEi allele and open boxes the SPRET/Ei allele. The number of animals with each haplotype is given at the bottom of each column of boxes. The percent recombination (R) between adjacent loci, equivalent to centimorgans, is given to the right of the figure, with the standard error (SE) for each R.

