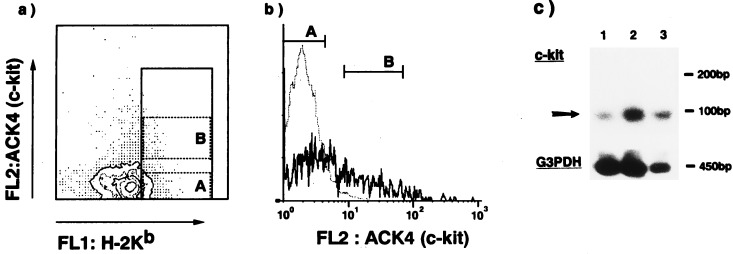
Figure 1.
Staining profiles (a, b) and RT-PCR analyses (c) of Lin−/CD71−/class Ihigh/c-kit<low cells. Lin−/CD71− cells were stained with anti-H-2Kb and anti-c-kit mAbs, and cells with a high expression of major histocompatibility class I were collected (represented in a). These cells were further divided into two populations based on the expression of c-kit [a and b (histogram)] and c-kit<low (A), and c-kitlow (B) cells were sorted by a FACStar. The dotted line in b represents a negative control stained by isotype-matched rat mAb. (c) RT-PCR-amplified products from a c-kit gene (upper) and from a glyceraldehyde 3-phosphate dehydrogenase (G3PDH) gene as an internal standard (lower) were electrophoresed, transferred to a nylon membrane, and probed with internal oligonucleotides. Lanes: 1, Lin−/CD71−/class Ihigh/c-kit<low cells; 2, Lin−/CD71−/class Ihigh/c-kitlow cells; and 3, Lin−/CD71− unsorted BMCs.

