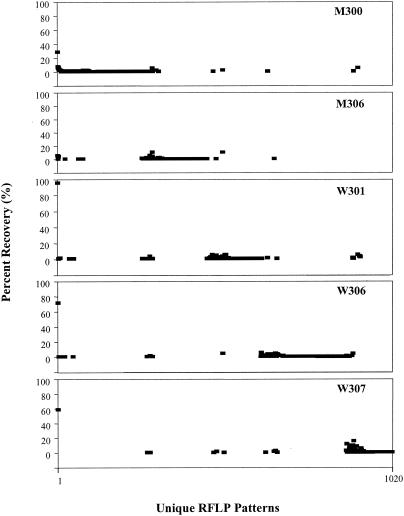
FIG. 2.
Spatial distributions of unique RFLP banding patterns (1,020 total, x axis) sampled from the Mexico (M) and Washington (W) margins. All unique RFLP patterns were ordered sequentially by site along the x axis (i.e., M300, M306, W301, W306, and W307). Percent recovery (y axis) of each unique RFLP pattern was calculated by site. The dominant RFLP pattern recovered from all of the sites is represented as the first data point in each panel.

