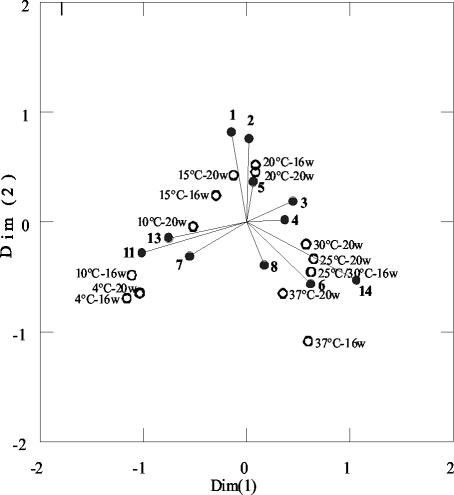
FIG. 7.
Correspondence analysis comparing the differences in DGGE banding patterns with the program SYSTAT 9. Open circles represent samples of KMS soil which were incubated at different temperatures (4 to 37°C) in the moist soil state. The names of samples indicate the incubation temperature and period of incubation in weeks (w). Solid circles with a line represent bands with numbers in bold.

