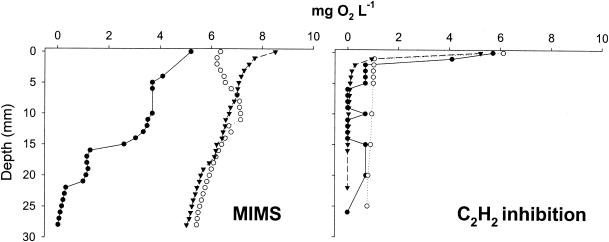
FIG. 1.
Selected profiles of dissolved-oxygen (O2) concentration with depth in sediment cores subjected to MIMS flowthrough incubation and C2H2 inhibition incubation. Concentrations were measured post-incubation periods. Different lines and symbols represent different replicate cores, with both sites represented.

