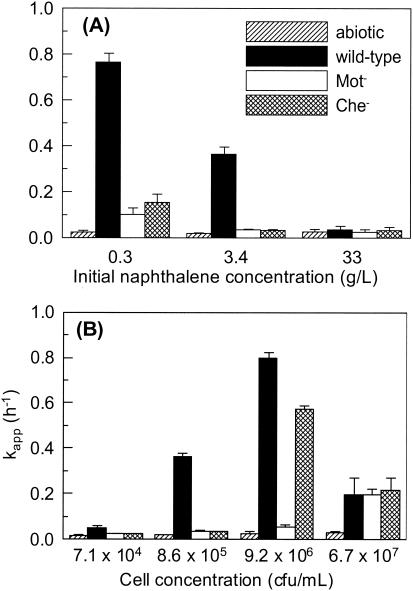
FIG. 2.
Effects of initial naphthalene concentration (A) and cell concentration (B) on the apparent rate coefficient for naphthalene loss from the HMN droplet. The cell concentration in the bacterial suspension for the experiment with results shown in panel A was 8.6 × 10⁵ CFU/ml, and the initial naphthalene concentration in the HMN droplet for the experiment with results shown in panel B was 3.4 g/liter. Error bars represent the 95% confidence intervals for kapp.

