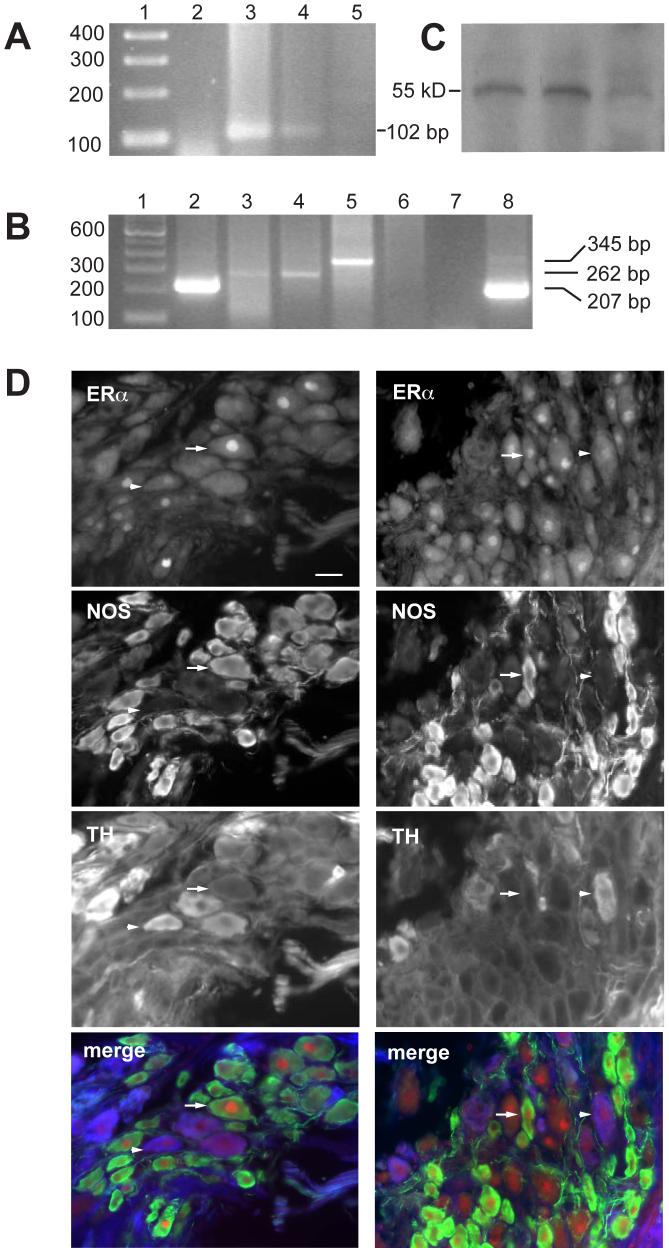
Aromatase RT-PCR yielded a 102 bp band in prostate and pelvic ganglion but not skeletal muscle; lane 1, 100 bp ladder; 2, blank; 3, prostate; 4, pelvic ganglion; 5, skeletal muscle.
ER RT-PCR yielded a 345 bp band for ERα and a 262 bp for ERβ in pelvic ganglion but only the ERβ transcript was present in prostate; lane 1, 100 bp ladder; 2, pelvic ganglion GAPDH (207 bp); 3, pelvic ganglion ERβ (262̣ bp); 4, prostate ERβ; 5, pelvic ganglion ERα(345 bp); 6, prostate ERα; 7 blank, ERα primers; 8, prostate GAPDH. For all primer sets, experiments were repeated twice.
Aromatase protein was identified in extracts of pelvic ganglia from three rats, each showing a single band at ∼55 kD.
Triple staining immunofluorescence showing examples of ERα expression in noradrenergic (TH-positive) and nitrergic (NOS-positive) pelvic ganglion neurons. Arrows show examples of ERα expression in NOS-positive, TH-negative neurons, and arrowheads show examples of weaker ERα expression in TH-positive, NOS-negative neurons. In merged colour images, ERα is red, NOS is green and TH is blue. Calibration in D represents 20 μm.

