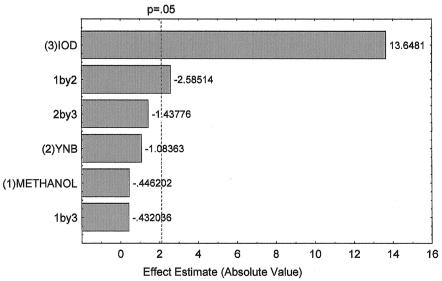
FIG. 3.
Pareto chart of the effect of medium composition on recombinant XynA expression by P. pastoris. The Pareto chart shows the values of the Student's t test for each medium component. The dotted line indicates the confidence level of 95% (i.e., P = 0.05). Values to the right of this line are statistically significant. Initial cell density (IOD) is the influence of initial cell density on xylanase production. 1by2 means the influence of both methanol and YNB concentration on xylanase production, and 2by3 stands for the influence of both YNB concentration and initial cell density on xylanase production. 1by3 stands for the influence of both methanol concentration and initial cell density on xylanase production. Xylanase activity was measured by the DNS procedure as described in Materials and Methods. The experiment was carried out in triplicate, and the values correspond to the averages of five measurements, with an error below 10%.

