FIG. 3.
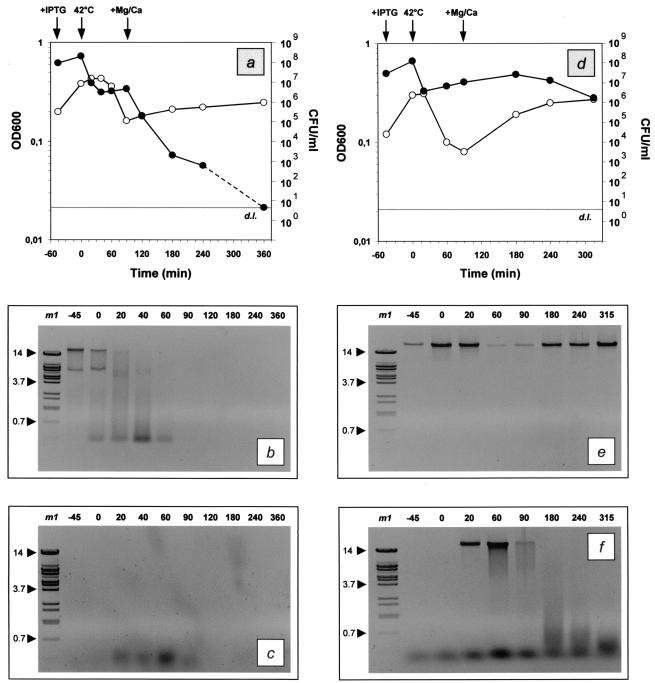
Growth and lysis kinetics and electrophoretic analysis of the total DNA content of E. coli NM522 harboring either pML1 plus pSNUC1 (a to c) or only pML1 (d to f). Diagrams a and d focus on the growth and lysis kinetics, which were monitored by measurement of the optical density at 600 nm (OD600; ○) and the determination of the number of CFU per milliliter (•). For practical reasons, the concentration of viable cells that fell below the lower limit of detection (grey lines; d.l.) is illustrated as corresponding to the detection limit, although it does not refer to a certain concentration of cells. The time points of supplementation with IPTG and Mg and Ca and the temperature upshift to 42°C are indicated by arrows. The total DNA contents within the pellets (b, e) and the supernatants (c, f) were analyzed by electrophoretic separation with 0.6% agarose gels. The time points of sampling are given in minutes relative to the time of lysis induction (0 min). Lane m1, BstEII-digested lambda DNA; the sizes of prominent fragments (indicated by arrowheads) are given in kilobases.

