
Figure 3. Tonic inhibition and its potentiation by ethanol are unaltered in α1H101R dentate gyrus molecular layer interneurons.
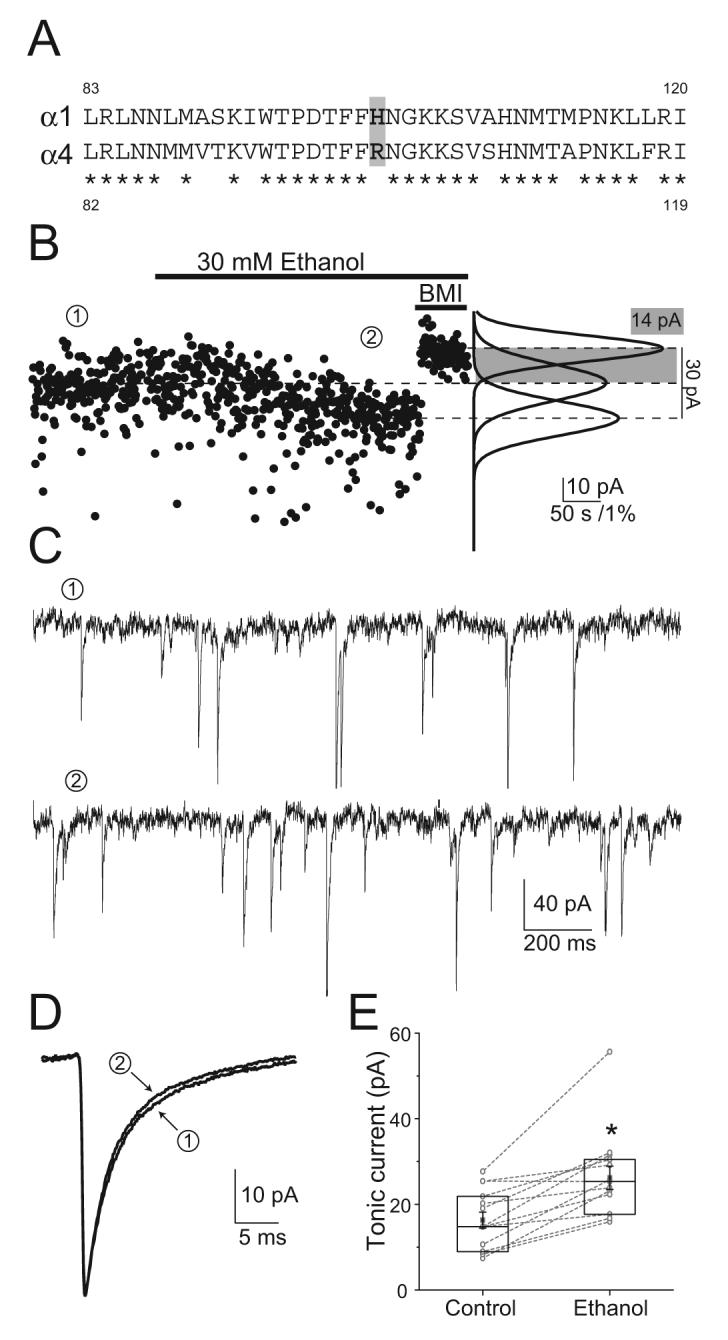
A) Amino acid alignment between α1 and α4 GABAAR subunits showing the position of the critical amino acid residue difference for BZ sensitivity. Asterisks indicate identical amino acids. B) Voltage-clamp recordings from α1H101R interneurons show a potentiation of the tonic inhibitory current by 30 mM ethanol. Left, baseline current plotted at 500-ms intervals in control (①), 30 mM ethanol (②) and BMI conditions (Vh= -70 mV, horizontal bars indicate perfusion of the drugs); Right, Gaussian fits to the all-point histograms of the baseline current recorded during each condition. C) Recording segments low-pass filtered at 1 KHz in control and ethanol conditions. D) Averaged sIPSC recorded in control and ethanol conditions from two different cells. E) Box-chart of all tonic currents recorded. Box represents the 25, 50, 75 percentiles, with the superimposed mean ± SEM. Circles connected by lines represent paired individual values of the tonic inhibitory currents recorded in a given cell under the two conditions. Asterisk represents p=0.0005 paired t-test; n=14.