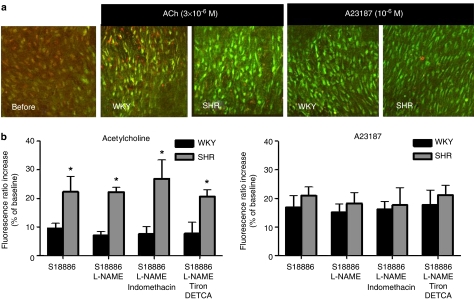
Figure 4.
(a) Merged images taken from confocal microscopy showing responses to infusion of acetylcholine (3 × 10⁻⁶ M) or A23187 (10−6 M) on cytosolic calcium of aortic endothelial cells from WKY and SHR. All strips were treated with L-NAME (10−4 M) and S18886 (10−7 M). An increase in green fluorescence and a decrease in red fluorescence indicate calcium rise. (b) The increase in fluorescence ratio in endothelial cells from SHR and WKY in response to acetylcholine (3 × 10⁻⁶ M) (left) or A23187 (10−6 M) (right) is expressed in percentages of the baseline values. Ratio was obtained by dividing Fluo-4/Fura-red-emitted fluorescence. Data shown as means±s.e.m.; n=5. The asterisk indicates a statistically significant difference between the two rat strains (P<0.05).

