
FIG. 4.
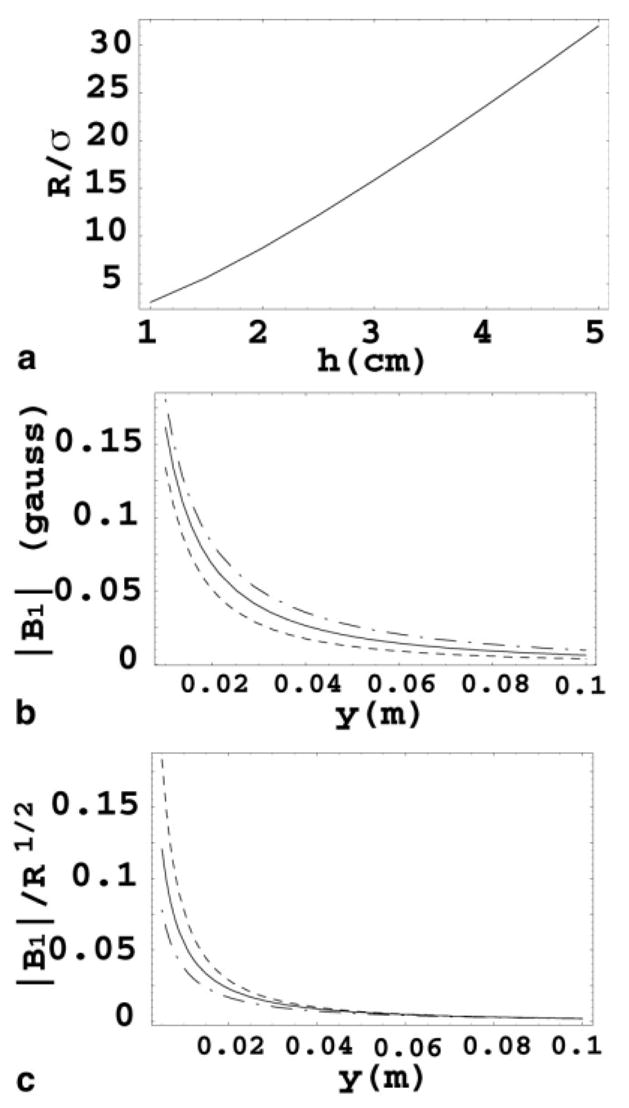
a: Ratio of noise resistance of the RTL to sample conductivity as a function of strip-to-ground distance h. b: Magnitude of B1 of the RTL as a function of vertical depth y from the center of the strip. c: SNR of the RTL as a function of vertical depth y from the center of the strip. |B1| and SNR exhibit quite different behaviors. Here the dashed, solid, and dash-dot lines correspond to h = 1 cm, 2 cm, and 4 cm, respectively.