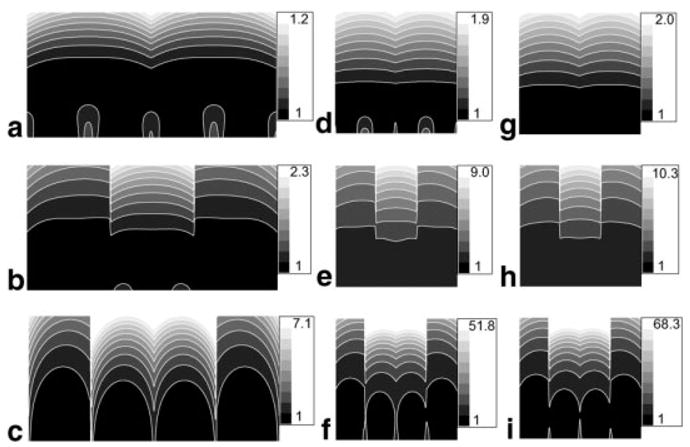
FIG. 6.

Axial view of the g-factor maps in the z = 0 plane for a four-element LPSA: for h = 2 cm, d = 10 cm, with a reduction factor of (a) 2, (b) 3, and (c) 4; for h = 2 cm, d = 6 cm, with a reduction factor of (d) 2, (e) 3, and (f) 4; for h = 1 cm, d = 6 cm, with a reduction factor of (g) 2, (h) 3, and (i) 4. The x-axis is horizontal, and scales (top right) indicate the g-value with contour intervals at one-tenth of the range.
