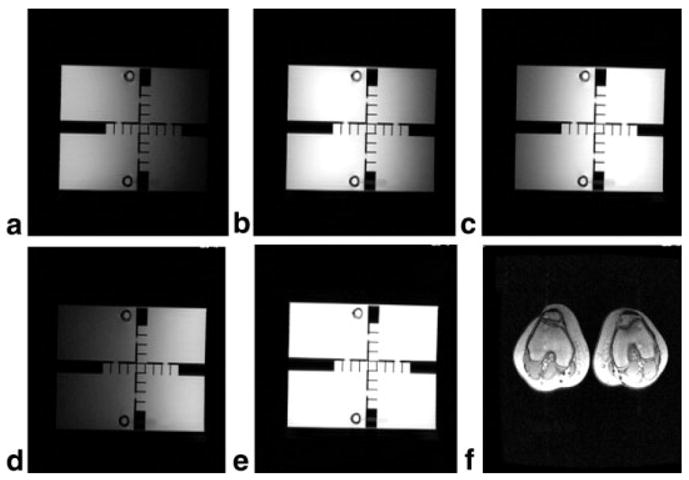
FIG. 9.

a–d: MR images acquired from each of the four different strips of the LPSA from a 27-cm-high, 20-cm-diameter phantom. e: Composite image produced using the root of the sum-of-the-squares method. Images were acquired with an FSE pulse sequence (echo train length (ETL) = 8, TE = 85 ms, TR = 2 s, NEX = 1, data-acquisition matrix 256 × 160, FOV = 36 cm). f: Composite phased-array axial image of the knees of a normal volunteer (TR = 150 ms, TE = 3.3 ms, NEX = 1, flip angle = 70, FOV = 48 cm, slice thickness = 7 mm, data matrix = 256 × 160, FOV = 48 cm).
