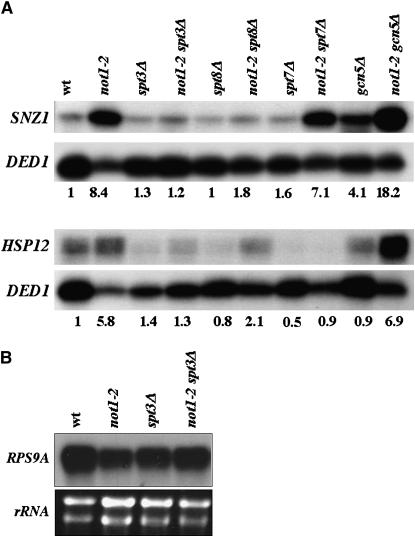
Figure 3.—
The deletion of SPT3 specifically reduces increased HSP12 and SNZ1 mRNA in not1-2. (A) The indicated strains were grown exponentially for 24 hr and then shifted at an OD600 of 0.2 to 37.5°. Total cellular RNA was prepared when cells reached an OD600 of 0.8 as in Figure 2. The levels of HSP12 and SNZ1 mRNAs were measured simultaneously to that of DED1 in 50 μg of total cellular RNA by S1 analysis. Because of the unequal loading of some lanes, the results were quantified by phosphoimager analysis. (B) The levels of RPS9A in 50 μg of total RNA were measured for the indicated strains, and the levels of rRNA in 5 μg of total cellular RNA are indicated as a control.

