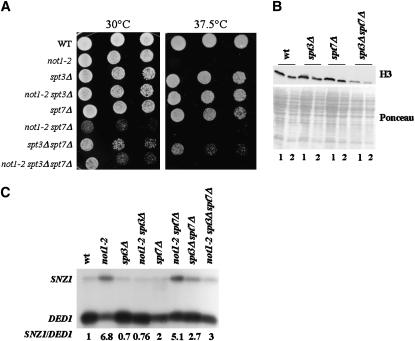
Figure 6.—
spt3Δ and spt7Δ display a synthetic phenotype. The indicated strains were grown exponentially for 24 hr and then (A) serially diluted and plated on glucose-rich plates that were placed at 30° or 37.5° as indicated for 3 days. (B) Strains shifted to high temperature, as in Figure 1, to an OD600 of 0.8. Total extracts were made by post-alkaline lysis and analyzed by Western blot for the levels of histone H3. The Ponceau staining is shown for loading control. Lane 1, 14 μl of post-alkaline lysis corresponding to 0.7 OD600; lane 2, 7 μl of post-alkaline lysis corresponding to 0.35 OD600. (C) Strains shifted to high temperature, as in Figure 1, to an OD600 of 0.8. Total cellular RNA was extracted and 50 μg were analyzed by S1 digestion for the levels of SNZ1 mRNAs and DED1 as an internal control. Results were quantified by phosphoimager analysis.

