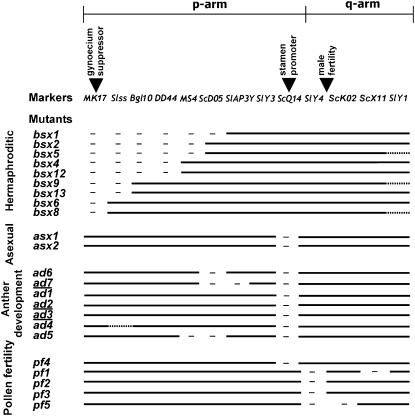
Figure 3.—
Outline of the deletions observed in the mutants analyzed. The markers are shown at the top, ordered according to the Y map (Hobza et al. 2006), with inverted triangles indicating the sex determination functions located on the p arm and a pollen fertility region on the q arm. The pseudo-autosomal region is on the right. The mutant names are given on the left. The underlined mutant names state for mutants with pairing phenotypes. Full lines indicate markers present in each deletion mutant, dashes indicate markers that were determined to be missing, and dotted lines indicate that the presence of the marker was not tested in the strain. Deletions are not to scale. Note that in several mutants more than one marker is deleted.

