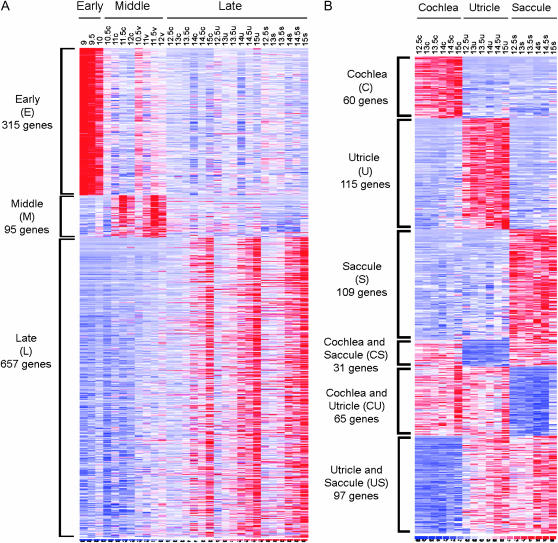
Figure 3.—
Gene expression heat maps that illustrate temporal and tissue-specific signatures. In both A and B, each column is an individual IE sample (indicated on top), and each row represents a gene. Expression level increases from blue to white to red. The number of genes indicated in each expression pattern denotes those whose expression peaked by at least twofold in that pattern with an estimated false discovery rate (FDR) of <0.5%. Refer to supplemental Table 4 for a listing of the individual genes and fold changes within these expression patterns. (A) Heat maps of genes exhibiting three of the six expression patterns resulting from EML analysis (Table 2). Specifically, 315 genes were highly expressed in early stages, 95 in middle stages, and 657 in late stages. (B) Heat maps of genes with six expression patterns based on tissue type alone resulting from L analysis (Table 2). Shown are 60 genes whose expression peaked only in the cochlea, 115 only in the utricle, 109 only in the saccule, 31 in cochlea and saccule, 65 in cochlea and utricle, and 97 in utricle and saccule. c, cochlea; v, vestibular organ; u, utricle; s, saccule.

