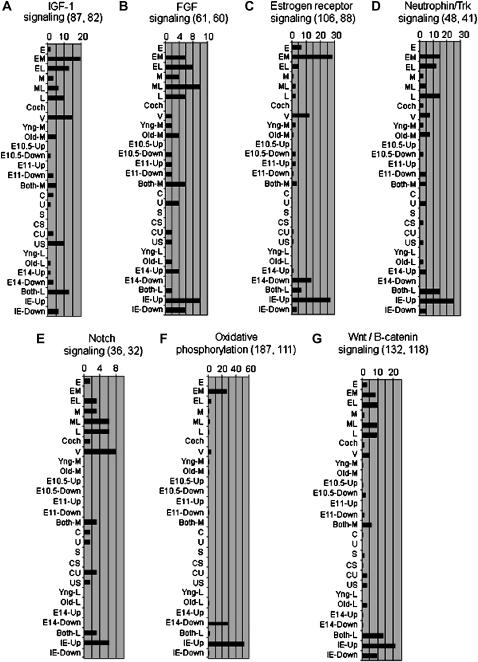
Figure 4.—
Examples of pathways deemed statistically significant by IPA within at least one expression pattern resulting from at least one analysis (see Table 2). To be deemed significant, the pathway is represented by at least two genes differentially expressed by ≥2-fold (for patterns of EML analysis) or ≥1.5-fold (for patterns of M and L analyses) with a Fisher's right-tailed exact test P-value of ≤0.05. The horizontal axis shows the percentage of genes within the pathway that varied in expression within a particular pattern of gene expression. For each pathway (A–G), the total number of genes (listed by Ingenuity) in the pathway and the number of pathway genes actually on the gene chip are shown in parentheses next to the pathway name. For example, in Notch signaling (E) a total of 36 genes are listed by Ingenuity, of which 32 were on the gene chip. The M pattern of gene expression shows differential expression of 2 notch pathway genes (6.25% of 32 genes). The E pattern exhibits differential expression of only 1 notch pathway gene (3.1% of 32 genes) and is thus not deemed significantly enriched for this pathway. Refer to supplemental Figure 5 for a similar depiction of all 53 pathways identified in this study.

