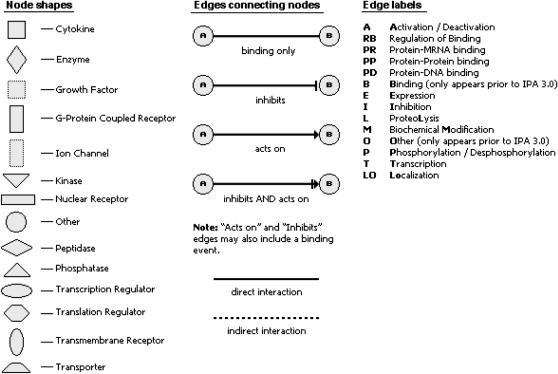
Figure 5.—
Examples of networks generated by IPA using genes whose expression was upregulated in (A) L (late category), (B) C (late cochlea), and (C) S (late saccule). Each gene list was uploaded in Ingenuity to identify interactions among the genes within the list and also with other genes not in the list. Upregulated genes are shown in different shades of red (fold change increases from light to bright red), and those in green are genes that were not differentially expressed but were present in the appropriate category/subcategory (L, C, or S). Solid blue lines denote direct interactions and dashed blue lines denote indirect interactions (refer to key). Also indicated are genes that are parts of several biological signaling pathways with a known role in the IE.


