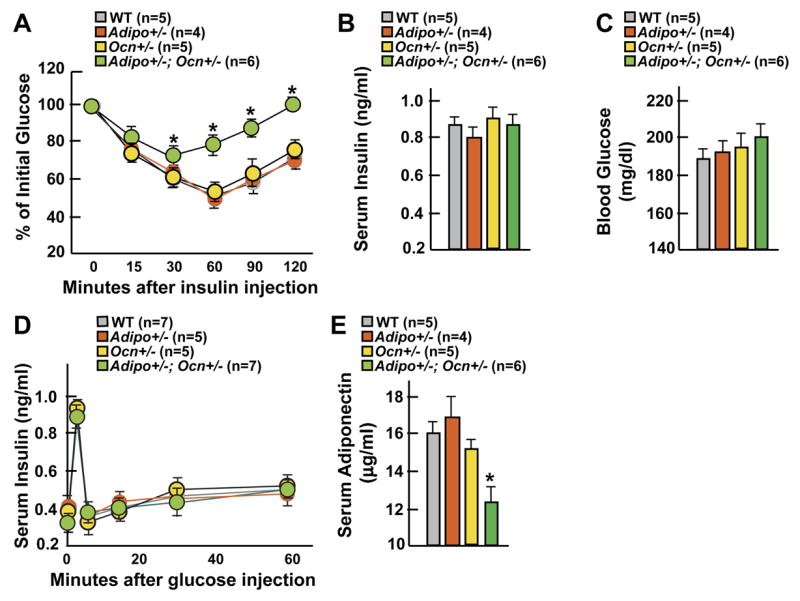
Figure 6. Osteocalcin regulates insulin sensitivity via adiponectin.

(A-E) Comparison between 6 week-old WT, Adiponectin+/ − (Adipo+/ −), Osteocalcin+/ − (Ocn+/ −) , and Ocn+/ −; Adipo+/ − mice. (A) ITT. (B) Insulin serum levels. (C) Blood glucose levels. (D) GSIS test. (E) Adiponectin serum levels. Panels A and D, *p 0.001 vs WT (ANOVA followed by post hoc analysis); panels B, C and E: *p<0.05 vs WT (Student’s t test).
