Figure 2.
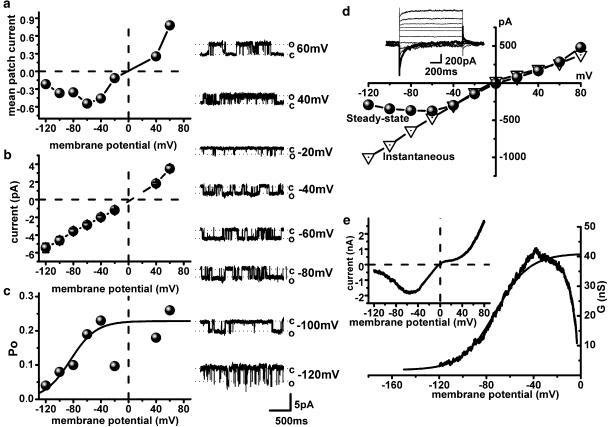
Voltage dependence of gating of the medium conductance channel (a, b and c) determines CCh-evoked whole-cell current (d, e). I–V relation of the mean patch current evoked by 50 μM carbachol (a) was obtained as a product of NPo and single channel amplitude at each test potential, and is U-shaped at negative potentials with the Erev close to 0 mV (compare to e inset). The 70 pS single channel I–V relation (b) is nearly linear and typical Po-voltage dependence (c) could be fitted by the Boltzmann relation between −120 and −40 mV as shown by the superimposed curve. Note that close to the reversal potential Po values are significantly reduced and therefore these points have been excluded from the fit, similarly to the whole-cell conductance values positive to about −40 mV shown in panel e (see text for details). Panels on the right show examples of single channel activity at different test potentials (from top to bottom: 60 to −120 mV, with an increment of 20 mV excluding 0 and 20 mV where channel activity was undetectable). Whole-cell instantaneous (triangles) and steady-state (circles) I–V relations (d) of current evoked by 50 μM CCh measured from the superimposed traces shown in the inset, were obtained by 1.2 s duration voltage steps applied from a holding potential of −40 mV to test potentials between −120 and 80 mV with increments of 20 mV. The effect of desensitization on the I–V curve was relatively small as during the measurements the holding current was reduced by 11±6% (n=9). Whole-cell I–V relationship (e) obtained by 6 s duration negative-going voltage ramp in the presence of 50 μM carbachol (inset) and the corresponding activation curve obtained by dividing current amplitude by the driving force. Data were fitted between −120 and −40 mV by the Boltzmann relation as shown by the smooth superimposed curve. Note that the activation curve (e) is similar to the Po-voltage dependence of the single channel (c).

