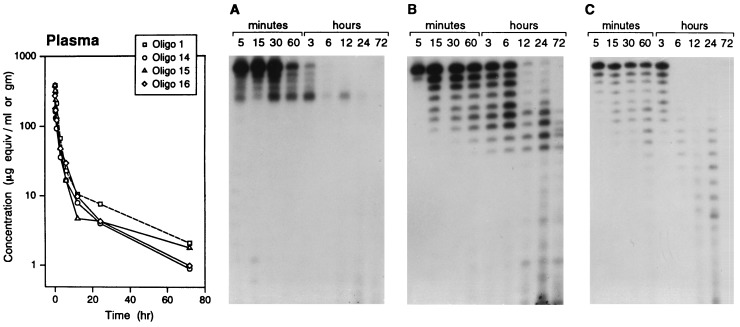
Figure 3.
Plasma clearance and stability of oligos 1 and 14–16. A plot of plasma concentration versus the time course of oligo-derived radioactivity (35S) is shown at the left. The plasma samples were extracted, and the oligos were analyzed after 5′ end-labeling with 32P by gel electrophoresis and were autoradiographed. (A) Oligo 14. (B) Oligo 16. (C) Oligo 15. (The data for oligo 1 are derived from a previous study, ref. 16.)

