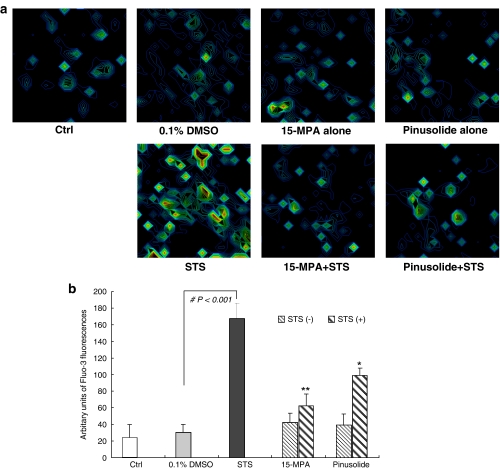
Figure 3.
Effect of 15-MPA and pinusolide on the [Ca2+]i increase in STS-injured rat cortical cells. (a) 3D pseudo fluorescence images of calcium indicator dye fluo-3 under a confocal microscope (488 nm excitation and 510 nm barrier filter) represent the intensity of Ca2+ in living cortical cells. Cultures were pretreated for 1 h with 5 μM 15-MPA or 5 μM pinusolide and were then exposed to 100 nM STS for 6 h. Cells grown on chambered coverglass were incubated in the presence of 0.1 μM fluo-3 AM for 30 min and then washed twice with HBSS. (b) The graph represents the quantification of the intensity of fluo-3 staining in each cell. Values are the mean±s.d. of determinations made in cells each of cultures (30 cells assessed). Mean value of the STS-treated cultures are significantly different (#P<0.001) from the value of the vehicle-treated cultures. *P<0.05, **P<0.01 vs STS-treated cultures.

