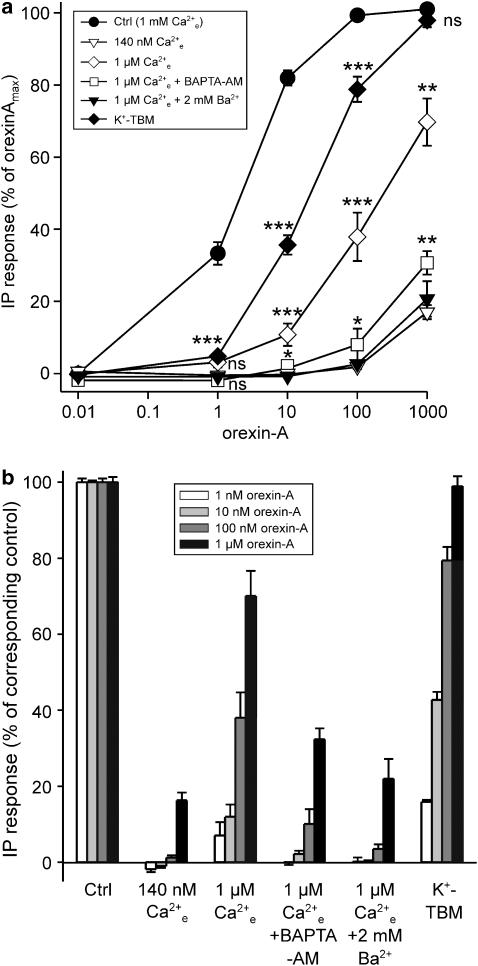
Figure 1.
The effect of reducing the level of Ca2+ on OX1R-stimulated PLC activity. A [Ca2+]e of 1 μM was obtained in nominally Ca2+-free TBM (no CaCl2 added), and 140 nM by adding 0.5 mM EGTA to this medium. For BAPTA-AM treatment, the cells were preincubated with 30 μM BAPTA-AM for 20 min; 1 mM probenecid was included both in the preincubation and the experimental media to inhibit extrusion of free BAPTA. The data are presented as % of maximum orexin-A response (a) and normalized to the control orexin-A response at each orexin-A concentration (b). The significances are indicated for K+-TBM compared to control, for 1 μM [Ca2+]e compared to K+-TBM, and for 1 μM [Ca2+]e+BAPTA-AM compared to 1 μM [Ca2+]e alone; 1 μM [Ca2+]e+BAPTA-AM, 1 μM [Ca2+]e+2 mM Ba2+ and 140 nM [Ca2+]e are not significantly different from each other. *P<0.05; **P<0.01; ***P<0.001.

