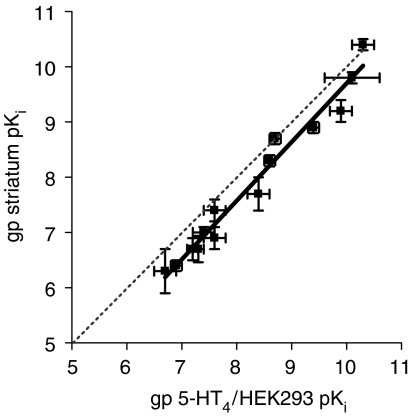
Figure 3.
Correlation plot for a range of 5-HT4 receptor agonist and antagonist pKi values at recombinant and native guinea-pig 5-HT4 receptors determined using [3H]GR113808 competition binding assays. The solid line represents a linear regression through the points, and the dashed line represents unity. Data represent mean±s.d. of 3–12 independent experiments.

