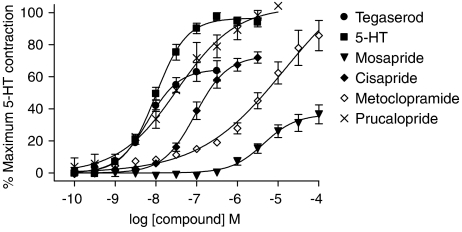
Figure 4.
Concentration–response curves to tegaserod, 5-HT, prucalopride, cisapride, metoclopramide and mosapride in the guinea-pig isolated colon LMMP. Values are expressed as the mean±s.e.m (vertical lines) change in tension, as a percentage of the primed, maximum 5-HT (0.3 μM) response in the same tissue.

