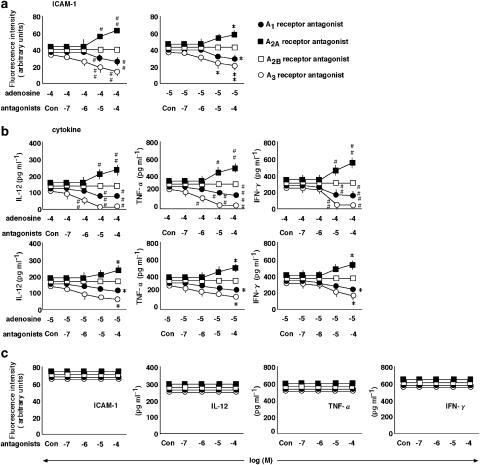
Figure 3.
The effects of A1, A2A, A2B and A3 receptor antagonists on the action of adenosine. (a) The effects of the selective A1, A2A, A2B and A3 receptor antagonists, DPCPX (•), ZM-241385 (▪), alloxazine (□) and MRS1220 (○), respectively, at concentrations ranging from 0.1 to 100 μM (Con, no antagonist) on the expression of ICAM-1 in the presence of IL-18 at 100 ng ml−1 and adenosine at 10 (right-hand graph) and 100 μM (left-hand graph). PBMC were treated with various stimulations and the expression of ICAM-1 on monocytes was examined by multi color flow cytometry using a combination of anti-CD14 antibody with anti-ICAM-1 antibody. (b) The effects of A1, A2A, A2B and A3 receptor antagonists (Con, no antagonist) on the production of IL-12, TNF-α and IFN-γ in the presence of IL-18 at 100 ng ml−1 and adenosine at 10 (lower graphs) and 100 μM (upper graphs). (c) The effects of antagonists at concentrations ranging from 0.1 to 100 μM (Con, no antagonist) on the expression of ICAM-1 and production of IL-12, TNF-α and IFN-γ by PBMC treated with IL-18 at 100 ng ml−1 in the absence of adenosine were determined. Results are expressed as the means±s.e.m. of triplicate determinations from five donors. #P<0.05, ##P<0.01 compared with the value for IL-18 and adenosine at 10 μM. *P<0.05, **P<0.01 compared with the value for IL-18 and adenosine at 100 μM. When an error bar was within a symbol, the bar was omitted.

