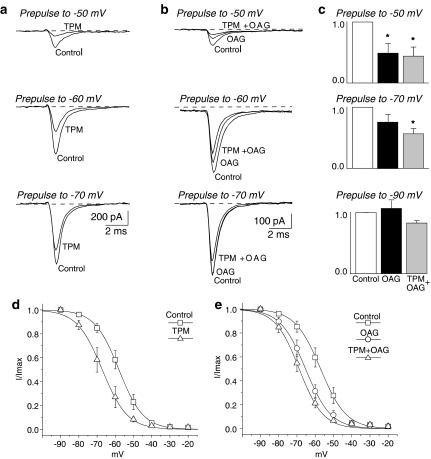
Figure 1.
Effects of topiramate (TPM) and OAG on steady-state INaT inactivation. (a and b) TTX-subtracted current traces evoked by 50 ms step depolarization to −15 mV after a 300 ms prepulse at different membrane potentials. (a) Na+ currents recorded in a neuron exposed to topiramate 100 μM. (b) Na+ current recorded in a neuron exposed to OAG 2 μM, and then to OAG plus topiramate. (c) The normalized peak amplitude of INaT evoked after conditioning pulses to −90, −70 and −50 mV during perfusion with OAG (black bar) or OAG + topiramate (grey bar) compared with the normalized value of the current peak measured under control conditions (white bar; *=P<0.05; n=8). (d and e) Steady-state inactivation curve obtained by plotting the current peaks (normalized to maximal values) against the prepulse potential. The curves show the fit obtained using a Boltzmann function applied to the data points calculated under control conditions and in the presence of topiramate (d), and under control conditions, in the presence of OAG and OAG plus topiramate (e).

