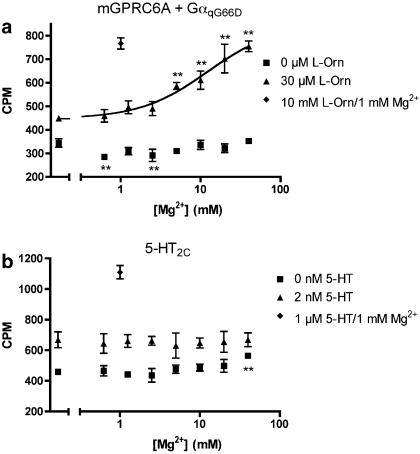
Figure 5.
Measurement of IP production as a function of extracellular Mg2+ concentration at mGPRC6A and 5-HT2C. (a) Response to Mg2+ measured in cells transiently co-expressing mGPRC6A and GαqG66D in the absence or presence of 30 μM L-Orn (∼EC25). The response to maximal concentration (10 mM) of L-Orn in the presence of 1 mM Mg2+ was used as control. (b) Response to Mg2+ measured in cells transiently expressing the 5-HT2C receptor, in the absence or presence of 2 nM 5-HT (∼EC25). The response to maximal concentration (1 μM) of 5-HT in the presence of 1 mM Mg2+ was used as control. All experiments were performed in the presence of 1 mM Ca2+. The formation of IP was determined as described under Methods. Results are expressed as CPM and are means±s.d. of triplicate determinations of a single representative experiment. Two additional experiments gave similar results. Asterisks indicate significant differences from the measurements where only Ca2+ was present: **P<0.01 (ANOVA followed by Dunnett's test).

